The circle graph shows the results of the student council presidential election and the percent of the vote each person received.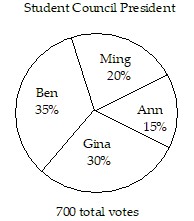 What percent of the votes did Ann NOT get?
A. 15%
B. 65%
C. 85%
D. 70%
Answer: C
You might also like to view...
The stack plot below shows the value of each of Danny's investments. The stack plot contains three regions. The uppermost unshaded region represents the value of Danny's investment in individual stocks. The center shaded region represents the value of Danny's investment in mutual funds and the bottom region in black represents the value of Danny's investment in a CD. The thickness of a region at a particular time tells you its value at that time.  Use the graph to answer the question.In which year was the value of Danny's investment in individual stocks the least?
A. year 0 B. year 7 C. year 1 D. year 8
Find the mean for the given frequency distribution.Find the approximate mean for the grouped frequency distribution. Use the class midpoint to represent each class. Round your answer to two decimal places.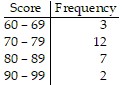
A. 78.12 B. 77.83 C. 74.50 D. 79.50
Subtract. Write the answer in lowest terms.
A. 
B. 
C. 
D. 
Determine how many of the first 5 statements in the sequence obtainable from the given statement are true.The measure of each exterior angle of a regular polygon with n sides is  . (n ? 3)
A. 3 B. 4 C. 2 D. 5