The graph below represents a competitive market for a product where the government now has introduced a price floor of 0C. Which area in the graph represents the producers' sales revenue after the imposition of the price floor?
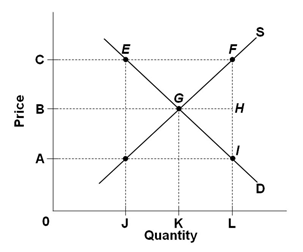
A. 0CFL
B. 0CEJ
C. 0BGK
D. 0BHL
B. 0CEJ
You might also like to view...
Economic growth is a sustained expansion of production possibilities measured as the increase in ________ over a given period
A) capital per person B) population C) real GDP D) real GDP per person E) the standard of living
If the opportunity cost of producing wheat in Canada is four buffalo and the opportunity cost of producing wheat in the U.S. is seven sheep then we know that
a. four buffalo must trade for seven sheep b. seven buffalo must trade for three sheep c. we have insufficient information to determine anything about their trade d. the U.S. should specialize in wheat e. Canada should specialize in wheat
The slope of the budget line is the amount of one commodity that a consumer must give up in order to obtain an additional unit of the other commodity
a. True b. False Indicate whether the statement is true or false
You and your friends watch a movie in your bedroom. For you and your friends, the enjoyment that you get from watching the movie is not rival in consumption
a. True b. False Indicate whether the statement is true or false