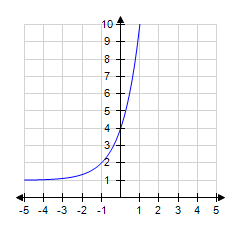
Use the graph to solve the problem.The graph depicts a relationship between scores achieved on an unspecified standardized test and family income. Find the rate of change of test scores with respect to family income.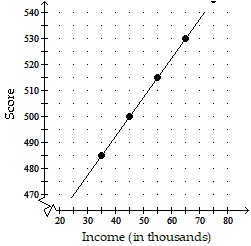
A. 15.1 point(s) per thousand dollars
B. 150 point(s) per thousand dollars
C. 1500 point(s) per thousand dollars
D. 1.5 point(s) per thousand dollars
Answer: D
Mathematics
You might also like to view...
Provide an appropriate response.Solve for x: log10  = x
= x
Fill in the blank(s) with the appropriate word(s).
Mathematics
Plot the relation in the xy-plane.{(0, -1.4), (-1.1, 1.5), (-0.8, 0), (0.8, -0.5), (-1, 0.6)}
A. 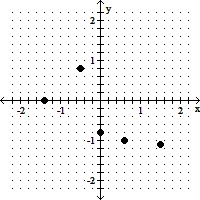
B. 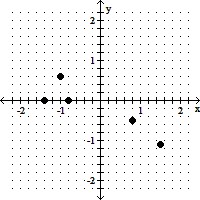
C. 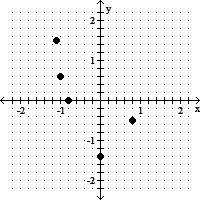
D. 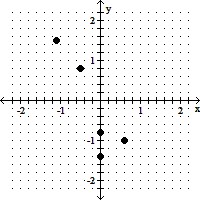
Mathematics
Graph the hyperbola. -
-  = 1
= 1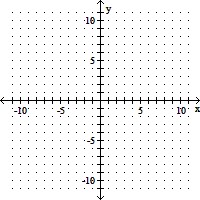
A. 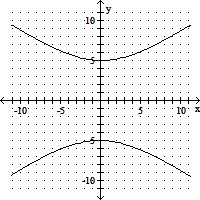
B. 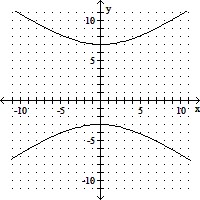
C. 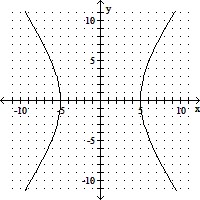
D. 
Mathematics
Graph the function using translations.
?
 ?
?
A. ?

B. ?
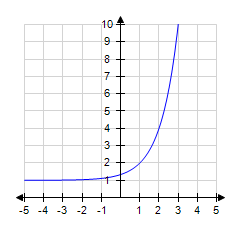
C. ?
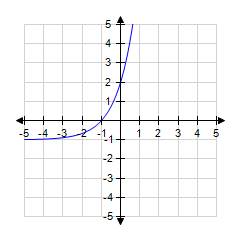
D. ?
Mathematics