Construct a histogram of the given frequency distribution.The frequency distribution indicates the number of speeding tickets for each person in a group of 456 drivers. 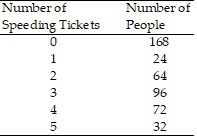
A. 
B. 
C. 
D. 
Answer: D
Mathematics
You might also like to view...
Use the integral test to determine whether the series converges.
A. converges B. diverges
Mathematics
Write as a percent. Round to the nearest hundredth of a percent when necessary.
A. 35.5% B. 71% C. 1000% D. 7.1%
Mathematics
Convert to rectangular coordinates.(2, 510°)
A. (-1,  )
)
B. (-  , 1)
, 1)
C. ( , -1)
, -1)
D. (1,  )
)
Mathematics
Classify the angle as acute, right, obtuse, or straight.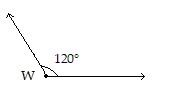
A. Straight B. Acute C. Right D. Obtuse
Mathematics