The table below represents Freedonia's macroeconomic data for Year 1 and Year 2.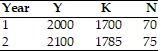 Suppose that the production function is given by Y = AK0.25N0.75. Between Year 1 and Year 2, total factor productivity of Freedonia's economy increased by
A. 5.5%.
B. 12.7%.
C. 5.0%.
D. -1.5%.
Answer: D
Economics
You might also like to view...
Which of the following measures is most often used to compare the standards of living in different countries?
A. life expectancy at birth B. per capita energy consumption C. per capita income D. daily per capita calorie supply
Economics
How is a potentially efficient change different from a Pareto optimal change?
What will be an ideal response?
Economics
______ are costs or benefits of a market activity experienced by someone outside of the immediate transaction.
A.) Externalities B.) Private goods C.) Public goods D.) Accounting costs
Economics
Transfer payments are paid mainly to
A. individuals. B. business firms. C. foreign countries. D. government bondholders.
Economics