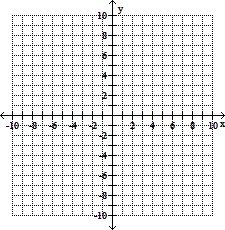
Use a graphing calculator to graph the function.f(x) = 

A. 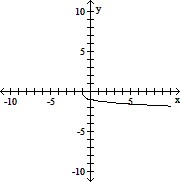
B. 
C. 
D. 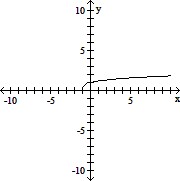
Answer: D
You might also like to view...
Graph f as a solid line and f-1 as a dashed line in the same rectangular coordinate space. Use interval notation to give the domain and range of f and f-1.f(x) = 
A. 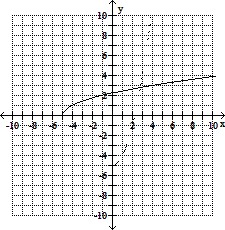
f domain = (0, ?); range = (-5, ?)
f-1 domain = (-5, ?); range = (0, ?)
B. 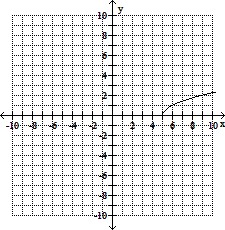
f domain = (0, ?); range = (5, ?)
f-1 Has no inverse.
C. 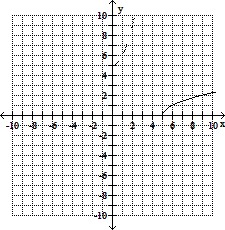
f domain = (0, ?); range = (5, ?)
f-1 domain = (5, ?); range = (0, ?)
D. 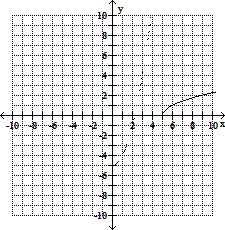
f domain = (0, ?); range = (5, ?)
f-1 domain = (-5, ?); range = (0, ?)
Solve the problem.The following table shows the population (in thousands) of Anytown, USA. YEAR POPULATION 1950 120 1960 100 1970 90 1980 105 1990 130 2000 160Use a graphing calculator to fit a quadratic function f(x) to the data. Use this equation to predict the population in the year 2010.
A. 190,000 B. 2,093,000 C. 213,000 D. 195,000
Give the additive inverse of the number.- 
A. - 
B. 7
C. 0
D. 
Write the opposite of the polynomial and simplify your result.-x4 - 6x3 - 3x
A. x4 + 6x3 + 3x B. x4 + 6x3 + 3 C. x4 + 6x3 + 3x2 D. -x4 + 6x3 + 3x