Solve the problem.The table shows the percentage of people living below the poverty line in one U.S. city in the years 2000 through 2003. 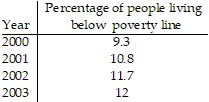 The data in the table can be written as ordered pairs (x, y) where x is the number of years after 2000 and y is the percentage of people living below the poverty line in that year. Use the data for 2000, 2002, and 2003 to find the quadratic function
  that models the percentage, y, of people in this city living below the poverty line x years after 2000. [Hint: Find a, b, and c by substituting each of three ordered pairs into
the function and writing and solving a system of linear equations in three variables.]
A. y = -0.3x2 + 1.8x + 9.3
B. y = -0.2x2 + 1.5x + 9.3
C. y = -0.2x2 + 1.6x + 9.3
D. y = -0.4x2 + 2x + 9.3
Answer: A
Mathematics
You might also like to view...
Calculate the derivative of the function. Then find the value of the derivative as specified.g(x) = -  ; g '(-2)
A. g '(x) = - 2x2; g '(- 2) = - 8
B. g '(x) = - 2; g '(- 2) = - 2
C. g '(x) = -  ; g '(- 2) = -
D. g '(x) =  ; g '(-2) =
Mathematics
Simplify.0.4 × 104
A. 16 B. 400 C. 10,000.4 D. 4000
Mathematics
Multiply.-6 ? 2
A. -6 B. -14 C. -12 D. 6
Mathematics
Perform the indicated operation and simplify. ?
? 
A. 
B. 
C. 
D. 
Mathematics