Refer to the graph below. Assume that D1 and S1 are the initial demand for and supply of dollars. The exchange rate will be:
The graph below shows the supply and demand curves for dollars in the pound/dollar market.
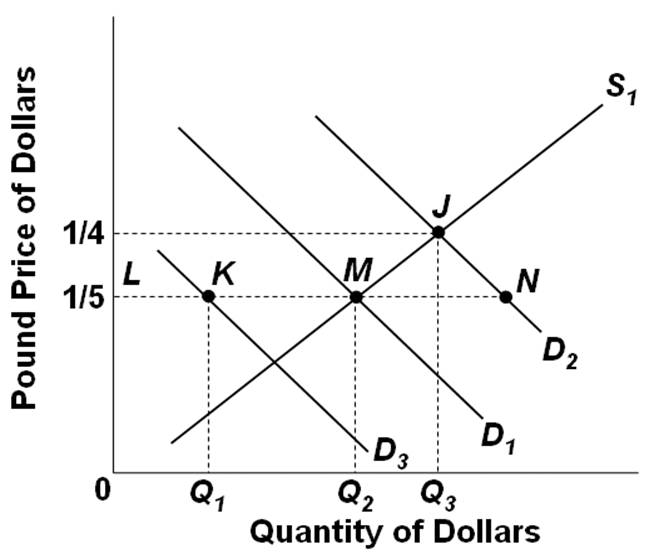
A. $5 equals 1 pound
B. $4 equals 1 pound
C. $1 equals 5 pounds
D. $0.20 equals 1 pound
A. $5 equals 1 pound
You might also like to view...
Demand for a product tends to be more elastic the longer the time period considered because
A) sellers have more time to expand production. B) buyers have more time to search for substitutes. C) price increases over time make the price larger relative to buyers' incomes. D) the inverse relationship between the price and the quantity demanded weakens over time. E) buyers get used to the new price.
If Finland has an absolute advantage in the production of two goods compared to Latvia, Finland can still benefit from trade with Latvia
Indicate whether the statement is true or false
If W is the nominal wage rate, N is the quantity of labor, P is the price level, and Y is real income, then labor's share in national income is
A) WN - PY. B) WP/YN. C) WN/PY. D) PY - WN.
Refer to the information provided in Figure 32.1 below to answer the question(s) that follow.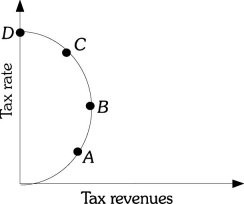 Figure 32.1Refer to Figure 32.1. The tax rate that will ________ is associated with Point B.
A. maximize tax revenue B. maximize unemployment C. minimize tax revenue D. minimize inflation