Histograms or frequency plots are best described as:
a. a graphical tool used to understand variability.
b. constructed with a block of data separated into five to twelve bars or sections from low number to high number.
c. will resemble a bell if the data is in control
d. all the above
Answer: D
You might also like to view...
S cam drum brakes have an S cam in each brake chamber why is it called an S cam
Counterboring a fit-up might be necessary to correct _____.
a. internal misalignment b. external misalignment c. the wrong size of pipe d. the wrong kind of fitting
How many 5-in-diameter, ¼-in thick disks can be fitted into a 4 ft-long, 5¼- diameter cylindrical container?
What will be an ideal response?
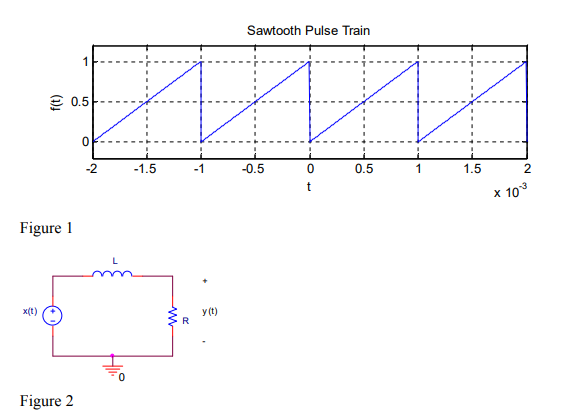
A sawtooth waveform f(t) shown in Figure 1 has amplitude A = 1 V and period T0 = 1 ms. The sawtooth signal f(t) is applied to a circuit shown in Figure 2. The output of the circuit is y(t). Let R = 800?, L = 100mH.
(a) Find the numerical values of an, bn, cn, ?n for 0 ? n ? 3.
(b) Represent f(t) as a sum of dc component, fundamental component, 2nd harmonic component, and 3rd harmonic component. The coefficients must be numbers.
(c) Find the transfer function H(?) of the circuit shown in Figure 2.
(d) Find the numerical values of |H(n?o)| and ?H(n?o) for 0 ? n ? 3. ?0 = 2?/T0.
(e) Find the magnitude ycn and phase y?n of the trigonometric Fourier coefficients of the output y(t).
(f) Represent y(t) as a sum of dc component, fundamental component, 2nd harmonic component, and 3rd harmonic component. The coefficients must be numbers.