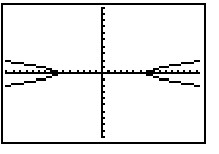
The hyperbola shown in the calculator-generated graph was graphed in function mode with a square viewing window. What are the two functions y1 and y2 that were used to obtain the graph whose equation is given? 10
10
 -10
-10
A. y1 =  , y2 = -
B. y1 =  , y2 = -
C. y1 =  , y2 = -
D. y1 =  , y2 = -
Answer: B
Mathematics
You might also like to view...
Find the value of the trigonometric function.sin 582°
A. -0.67 B. -0.21 C. -0.74 D. -0.95
Mathematics
Find the missing value so that the line containing the two points will have the required slope.(8, 17) and (9, y); m = - 20
A. 9 B. 0 C. 17 D. -3
Mathematics
Find the area under the curve over the indicated interval.
y = 2/x; [1,4]
Mathematics
Match the function with the correct table values.f(x) = 
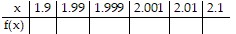
A. -0.3762; -0.3975; -0.3998; -0.4003; -0.4025; -0.4263 B. 0.4762; 0.4975; 0.4998; 0.5003; 0.5025; 0.5263 C. -0.5762; -0.5975; -0.5998; -0.6003; -0.6025; -0.6263 D. -0.4762; -0.4975; -0.4998; -0.5003; -0.5025; -0.5263
Mathematics