Economic growth may be represented by a:
A. production possibilities curve that remains fixed.
B. rightward shift of the production possibilities curve.
C. point outside (to the right) of the production possibilities curve.
D. leftward shift of the production possibilities curve.
Answer: B
You might also like to view...
If real disposable income is $300 billion and real consumer expenditures are $250 billion, it can be assumed that
A. the government is spending the difference. B. the difference is being invested. C. households are saving the difference. D. transfer payments make up the difference.
Using the Lorenz curve, the degree of income inequality is measured by
a. The line connecting all points for which a given percentage of families receives exactly the cumulative percentage of income b. the distance of the Lorenz curve from the line of perfect equality c. the flat diagonal line that applies to a perfectly elastic demand curve d. the number of times the Lorenz curve crosses the line of perfect equality e. is derived by dividing the number of people below the poverty line by the total population
In national income accounting, government purchases include:
A. purchases by federal, state, and local governments. B. purchases by the federal government only. C. government transfer payments. D. purchases of goods for consumption but not public capital goods.
Refer to the information provided in Figure 3.14 below to answer the question(s) that follow.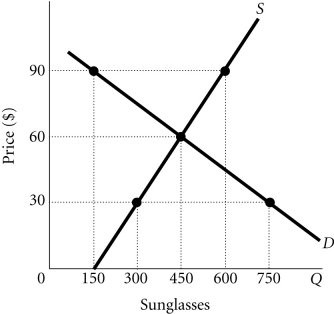 Figure 3.14Refer to Figure 3.14. If this market is unregulated and the price is currently $90, you would expect that the price of sunglasses would
A. fall to $30, so firms could sell their excess supply. B. fall to $60, where quantity demanded equals quantity supplied. C. remain at $90, because firms would not want to reduce the price. D. fall, but the new price is indeterminate from the information provided.