Exhibit 16-3 Money market demand and supply curves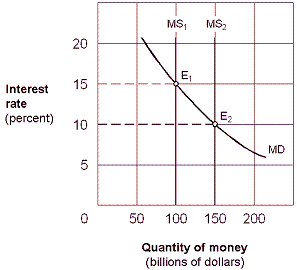
In Exhibit 16-3, assume an equilibrium with an interest rate of 15 percent and the money supply at $100 billion. The Fed uses its policy tools to move the economy to a new equilibrium at E2 with money supply of $150 billion and an interest rate of 10 percent. This change could be the result of a(n):
A. open market sale of securities by the Fed.
B. higher discount rate set by the Fed.
C. higher required-reserve ratio set by the Fed.
D. open market purchase of securities by the Fed.
Answer: D
You might also like to view...
A mugger steals $25 from John Doe. What can an economist conclude?
A) Nobody gained in the "exchange." B) Both parties gained in the "exchange." C) Only the mugger's wealth has increased. D) Nothing, because economists study strictly voluntary exchanges.
The redistribution of income creates the big tradeoff, which is a tradeoff between ________
A) income and wealth B) equity and efficiency C) rich and poor D) Supplementary Security Income and the Food Stamp program
In 2018, Janice Quinn sells a five-year-old car to Used Car, Inc. for $4,000. In the same year, Used Car, Inc. resells the car to Hilda Goner for $4,750. What is the contribution of these transactions to GDP in the year 2015?
A. $750 B. $0 C. $8,750 D. $4,000
The circular flow model:
a. Illustrates the interdependence of businesses and consumers b. Assumes that central planning is taking place c. Illustrates how natural resources are created d. Illustrates how money is created by the banking system