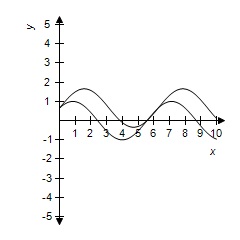
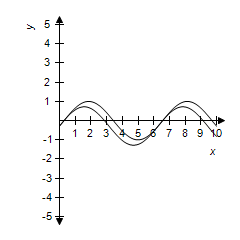
Use a graphing utility to select correct graph of  and
and  in the same viewing window. Use the graphs to determine whether
data-wiris-created="true" class="wirisformula" align="middle" />. Explain your reasoning.
?

?
A. ?
No, because their graphs are different.
B. ?
Yes, because their graphs are different.
C. ?
Yes, because their graphs are same.
D. ?
No,  because their graphs are Same.
E. ?
No, because their graphs are different.
Answer: E
You might also like to view...
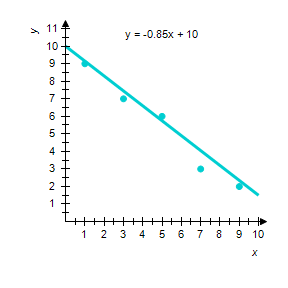
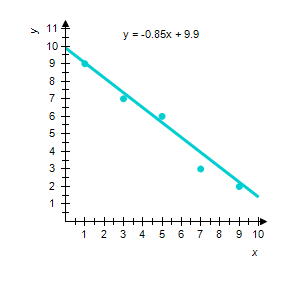
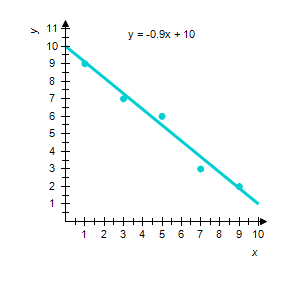
Find the equation of the least-squares line for the given data. Draw a scatter diagram for the given data and graph the least-squares line. x13579y97632? ?
A. ?
B. ?
C. ?

D. ?
Solve.x2 - 100 = 0
A. -10, 10 B. 10 C. 50 D. -11, 11
Determine if the function is concave up or concave down in the first quadrant.y = x5.4
A. Concave up B. Concave down
Factor completely.125 - (m + 2n)3
A. [5 - (m + 2n)][(25 + 5(m + 2n) + (m + 2n)2] B. [25 - (m + 2n)][(5 + 5(m + 2n) + (m + 2n)2] C. [5 - (m + 2n)][(25 - 5(m + 2n) + (m + 2n)2] D. [5 - (m + 2n)][(25 + (m + 2n)2]