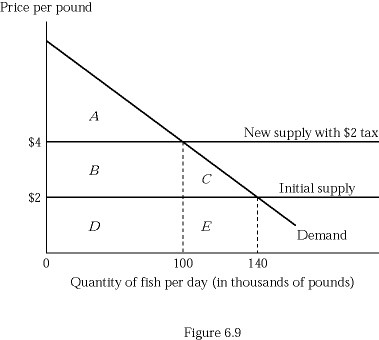
 Figure 6.9 depicts a hypothetical fish market with a horizontal supply curve. Suppose the government imposes a tax of $2 per pound of fish, and the tax is paid in legal terms by producers. Which of the following shows the tax revenue raised by the government?
A. Triangle A
B. Rectangle B
C. Rectangle B + Triangle C
D. Rectangle B + Rectangle D
Answer: B
You might also like to view...
When the price level rises, the long-run aggregate supply curve ________
A) shifts rightward B) does not shift C) slopes upward D) shifts leftward
The setting of minimum wages in the U.S. began with the ________
A) Sherman Anti-Trust Act of 1890 B) Garn St. Germain Act of 1982 C) Depository Institutions Deregulation and Monetary Control Act of 1980 D) Fair Labor Standards Act of 1938
In the treatment of American exports and imports, national income accountants
A. subtract exports, but add imports, in calculating GDP. B. subtract both exports and imports in calculating GDP. C. add both exports and imports in calculating GDP. D.add exports, but subtract imports in calculating GDP.
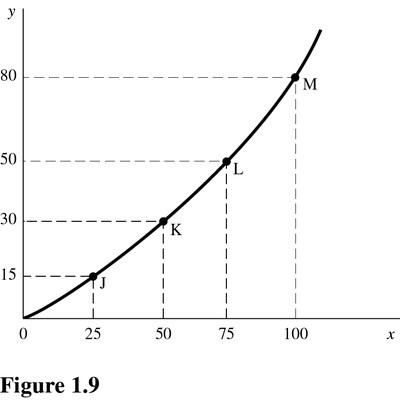 In Figure 1.9, the slope of the line between points K and L is
A. 0.60. B. 0.75. C. 0.80. D. 1.25.