The circular-flow diagram is a
a. visual model of the economy.
b. visual model of the relationships among money, prices, and businesses.
c. model that shows the effects of government on the economy.
d. mathematical model of how the economy works.
a
You might also like to view...
Air fares are generally lower on Tuesdays and Wednesdays each week. What is a likely explanation for this occurrence?
A. Supply is relatively variable, and lower demand on these days leads to a lower equilibrium price. B. Demand is relatively variable, and lower supply leads to a lower equilibrium price. C. Lower levels of both supply and demand on these days lead to a lower equilibrium price. D. Supply is relatively fixed, and lower demand on these days leads to a lower equilibrium price. E. Demand is relatively fixed, and lower supply leads to a lower equilibrium price.
If the inflation that results from targeting unemployment becomes unacceptably high, low inflation can be restored
Lower inflation can be obtained by ________ the growth rate of aggregate demand, by ________ money growth, and by________ interest rates. A) lowering; accelerating; raising B) raising; slowing; raising C) lowering; slowing; raising D) lowering; accelerating; lowering E) lowering; slowing; lowering
According to a model of intergenerational equity, if future generations are expected to be better off than the current generation, transfers should
A. go from the richer generation to the poorer generation. B. not be done at all. C. go from the poorer generation to the richer generation. D. be weighted by increases in the inflation rate.
Refer to the information provided in Figure 13.10 below to answer the question(s) that follow. 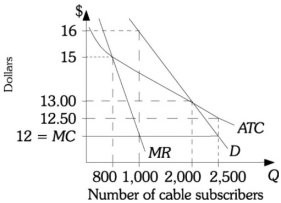 Figure 13.10 Refer to Figure 13.10. If Armstrong Cable ________, it will incur a loss of $1,250.
A. charges any price below the profit-maximizing price B. is forced to sell the efficient level output C. shuts down D. charges a price of $16 per subscriber