A Phillips curve illustrates a tradeoff between the __________________ rate and the inflation rate.
a. unemployment
b. tax
c. growth
d. import
a. unemployment
You might also like to view...
A firm produces 500 units per week. It hires 20 full-time workers (40 hours/week) at an hourly wage of $15 . Raw materials are ordered weekly and they costs $10 for every unit produced. The weekly cost of the rent payment for the factory is $2,250 . How do the overall costs breakdown?
a. total variable cost is $17,000 . total fixed cost is $2,250; total cost is $19,250 b. total variable cost is $12,000 . total fixed cost is $7,250; total cost is $19,250 c. total variable cost is $5,000 . total fixed cost is $14,250; total cost is $19.250 d. total variable cost is $5,000 . total fixed cost is $2,250; total cost is $7,250
Explain why the marginal propensity to save and the marginal propensity to consume sum to 1
Using Figure 1 above, if the aggregate demand curve shifts from AD2 to AD3 the result in the long run would be: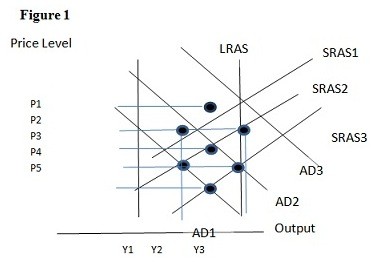
A. P2 and Y2. B. P1 and Y2. C. P4 and Y2. D. P1 and Y1.
A detailed history of business cycles is known as a
A. business cycle chronology. B. trend analysis. C. Hodrick-Prescott filter. D. historical decomposition.