The following comparison line graph indicates the number of vehicles sold for a seven week period by two different salespeople. Use the graph to answer the question.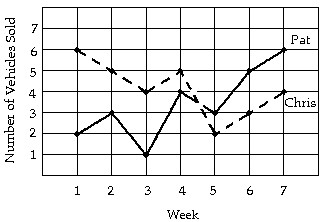 During what week did Chris sell the fewest number of vehicles?
A. Week 3
B. Week 5
C. Week 1
D. Week 7
Answer: B
Mathematics
You might also like to view...
Evaluate the integral.
A. cos x ln(cos x) + cos x + C B. sin x ln(cos x) - cos x + C C. -cos x ln(cos x) + sin x + C D. -cos x ln(cos x) + cos x + C
Mathematics
Solve the system. x - y + 5z = 52x + z = 0 x + 2y + z = -10
A. (0, -5, 5) B. (0, -5, 0) C. (0, 0, -5) D. No solution
Mathematics
Find the center and radius of the circle.x2 + y2 = 64
A. Center: (0, 0); radius: 8 B. Center: (1, 1) ; radius: 8 C. Center: (0, 0) ; radius: 64 D. Center: (1, 1); radius: 64
Mathematics
The function f is a probability density function defined on the given interval. Find  .
?
.
?
 ?
?
A. ?
B. ?
C. ?
D. ?
E. ?
Mathematics