Using Figure 1 above, if the aggregate demand curve shifts from AD2 to AD1 the result in the long run would be: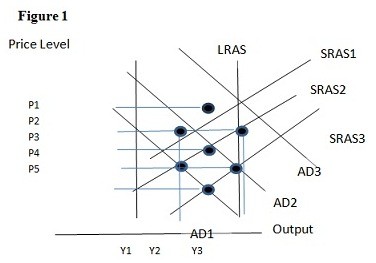
A. P4 and Y1.
B. P4 and Y2.
C. P5 and Y1.
D. P5 and Y2.
Answer: D
You might also like to view...
"Supply creates its own demand" implies that
A) the very act of supplying a particular level of goods and services will not necessarily equal the level of goods and services demanded. B) the very act of demanding a particular level of goods and services necessarily equals the level of goods and services supplied. C) the very act of supplying a particular level of goods and services necessarily equals the level of goods and services demanded. D) the government will buy up any surplus of goods and services in a country to avoid economic problems.
Refer to the above figure. The figure represents the saving function for the consumer. Point B represents
A) the amount of autonomous consumption. B) the point at which saving equals zero. C) a situation in which saving is negative. D) a situation in which saving is positive.
Explain how automatic stabilizers work
What will be an ideal response?
Conventional economic theory assumes that people
a. care a great deal about fairness. b. are inconsistent over time in their decisionmaking. c. are rational. d. are satisficers.