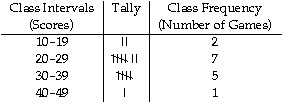
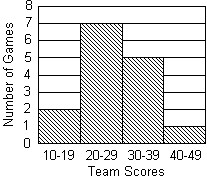
Fill in the frequency distribution table and draw its related histogram.The list shows the scores for a basketball team. Use the list to complete the frequency distribution table and construct a histogram.20?21?15?23?2831?32?30?19?3234?42?29?23?20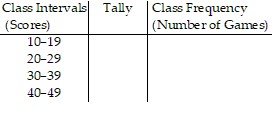 ?
?
What will be an ideal response?
Mathematics
You might also like to view...
Divide.-25 ÷ (-0.05)
A. 500 B. 5 C. 50 D. 0.5
Mathematics
Write the first four terms of the sequence.an = 
A. 5, 10,  ,
, 
B. 1, 32,  ,
, 
C.  ,
,  ,
,  ,
, 
D.  ,
,  ,
,  ,
, 
Mathematics
Find all local extreme values of the given function and identify each as a local maximum, local minimum, or saddle point.
A.  saddle point;
  saddle point
B.  local maximum
C.  local minimum;
  saddle point;
  saddle point;
  local maximum
D.  local maximum;
  local minimum
Mathematics
Find the value of the constant k that makes the function continuous.h(x) = 
A. k = 6 B. k = 12 C. k = -3 D. k = 3
Mathematics