Solve the problem.The following data represents the normal monthly precipitation for a certain city in California.  Draw a scatter diagram of the data for one period. Find a sinusoidal function of the form
  that fits the data. Draw the sinusoidal function on the scatter diagram. Use a graphing utility to find the sinusoidal function of best fit. Draw the sinusoidal function of best fit on the scatter diagram.
What will be an ideal response?
y = 3.14 sin (0.46x + 1.52) + 3.16
You might also like to view...
Evaluate the integral by first transforming it into integrable form with an appropriate algebraic substitution. dx
dx
A.  (x - 2)11/4 +
  (x - 2)7/4 + C
B.  (x - 2)7/4 +
  (x - 2)3/4 + C
C. 4(x - 2)11/4 + 8(x - 2)7/4 + C
D.  (x - 2)2 + 2(x - 2) + C
Write the equation in standard form. Then identify the vertex of the parabola.x = y2 - 7y - 2
A. x =  2 -
2 -  ;
; 
B. x =  2 -
2 -  ;
; 
C. x =  2 -
2 -  ;
; 
D. x =  2 - 2;
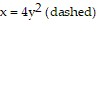
Use the shell method to find the volume of the solid generated by revolving the shaded region about the indicated line.About the line y = -1x = 4 (solid)
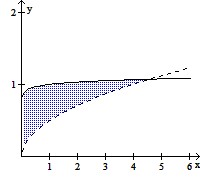
A.  ?
?
B.  ?
?
C.  ?
?
D.  ?
?
Find the logarithm using the change-of-base formula. Round to the nearest ten-thousandth.log3.3 166
A. 4.2817 B. 0.2336 C. 2.2201 D. 50.3030