Graph the inequality y?3x-1.
What will be an ideal response?
 answer.png)
Mathematics
You might also like to view...
Graph the region described by the inequality.x - y > -3
A. 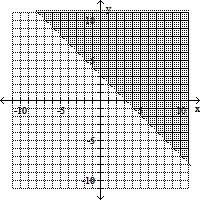
B. 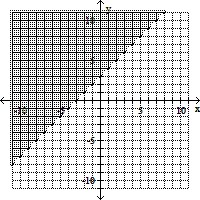
C. 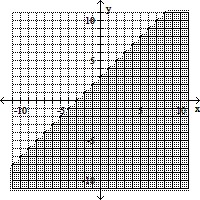
D. 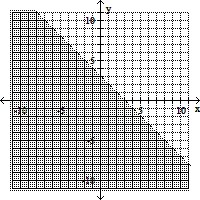
Mathematics
Simplify the expression. Assume all variables represent positive real numbers.
A. 10k7q8
B. 10q4
C. 10k3q4
D. 10k3q4
Mathematics
Find the foci of the ellipse. +
+  = 1
= 1
A. (-7, -5), (9, -5) B. (-5, -5), (7, -5) C. (-9, -5), (11, -5) D. (-5, -5), (-5, 7)
Mathematics
Solve the problem.The logistic growth function f(t) =  describes the population of a species of butterflies
  after they are introduced to a non-threatening habitat. How many butterflies were initially introduced to the habitat?
A. 9 butterflies B. 70 butterflies C. 720 butterflies D. 2 butterflies
Mathematics