Use algebraic and/or graphical methods to solve the inequality. ?
? 
A. -1 < x ?  or 5 < x ?
B. -1 < x <  or 5 < x <
C. -1 < x ?  or 5 < x ?
D. -1 < x ?  or 5 < x ?
Answer: A
You might also like to view...
The following table shows the number N, in thousands, of newspaper subscriptions t years after initial publication. Use exponential regression to determine when the number of subscriptions can be expected to reach 236.64 thousand. Round your answer to two decimal places. t 0 3 6 9 12 N 6.27 15.30 36.61 91.11 229.09?
A. 12.13 years after initial publication B. 14.50 years after initial publication C. 14.60 years after initial publication D. 13.96 years after initial publication
Simplify the power of i.i83
A. i B. -i C. -1 D. 1
Solve the problem.The one-day temperatures for 12 world cities along with their latitudes are shown in the table below. Make a scatter diagram for the data. Then find the line of best fit and graph it on the scatter diagram.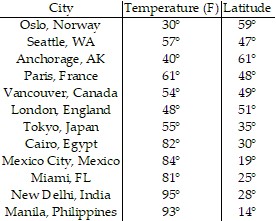 Latitude (degrees)
 Temperature (F)°
What will be an ideal response?
Perform the indicated operations and simplify the result. Leave the answer in factored form.
A. - 
B. - 
C. 
D. 