The data in the figure below represents the annual salaries of 120 professional mathematicians.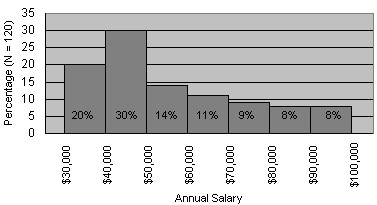
The kind of graph shown above is called
A. a frequency table.
B. a box plot.
C. a bar graph.
D. a histogram.
E. none of these
Answer: D
Mathematics
You might also like to view...
Solve the problem. Snell's Law states that  Use this law to find the requested value. If

 find
find  Round your answer to the nearest degree.
A. ?1 = 53° B. ?1 = 51° C. ?1 = 48° D. ?1 = 50°
Mathematics
Use one or more transformations to graph the function.y = x2 - 3 
A. 
B. 
C. 
D. 
Mathematics
Round the whole number to the given place value.4278, hundreds
A. 4200 B. 4290 C. 4400 D. 4300
Mathematics
Solve the given equation. 2cos²? + 5cos? - 12 = 0
What will be an ideal response?
Mathematics