Solve the problem.A research team collected data concerning a local habitat for an endangered species of bird. The data are summarized in the graph below. Call the function f.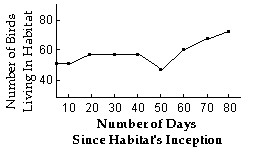 Does f have an inverse? Why or why not?
A. Yes, because it passes the vertical line test.
B. Yes, because it passes the horizontal line test.
C. No, because it fails the horizontal line test.
D. No, because it fails the vertical line test.
Answer: C
You might also like to view...
Graph the equation as a solid line. Graph the inverse relation as a dashed line on the same axes by reflecting across the line y = x.x = 6
A. 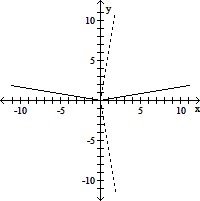
B. 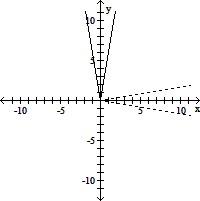
C. 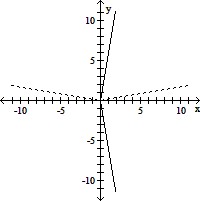
D. 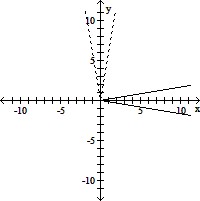
Find the equation of the line of best fit from the data in the table. Round the slope and the y-intercept to the nearest hundredth.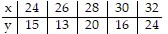
A. y = 0.95x - 11.8 B. y = 0.95x + 11.8 C. y = 1.05x - 11.8 D. y = 1.05x + 11.8
Find all angles ? between 0 and 180° satisfying the given equation. Round all answers to two decimal places. sin? = 0.7
What will be an ideal response?
Estimate the fraction as 0,  , or 1.
A. 
B. 0
C. 1