Identify the figure as a line, a line segment, or a ray and name it.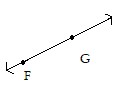
A. line 
B. line segment 
C. 

D. line 
Answer: A
You might also like to view...
The bar graph shows the number of tickets sold each week by the garden club for their annual flower show.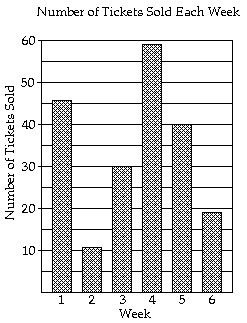 During which week was the most number of tickets sold?
A. Week 4 B. Week 1 C. Week 2 D. Week 5
Graph.y2 - 4x2 = 36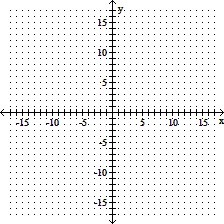
A. 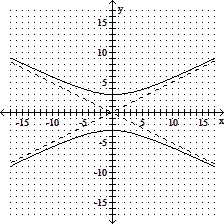
B. 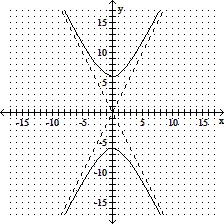
C. 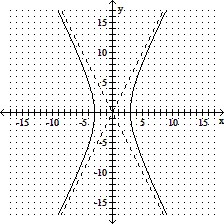
D. 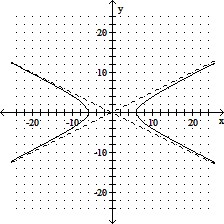
The given Treasury bill was sold in April of this year. Find (i) the price of the T-bill, and (ii) the actual interest rate paid by the Treasury. Round dollar amounts to the nearest cent and interest rates to the nearest thousandth.Six-month $17,000 T-bill with discount rate 0.130%
A. (i) $17,011.05; (ii) About 0.13% B. (i) $16,998.90; (ii) About 0.013% C. (i) $16,988.95; (ii) About 0.13% D. (i) $16,986.74; (ii) About 0.156%
Perform the indicated operation (write the result in scientific notation with the decimal part rounded to three significant if necessary).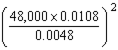

What will be an ideal response?