The following comparison line graph indicates the number of vehicles sold for a seven week period by two different salespeople. Use the graph to answer the question.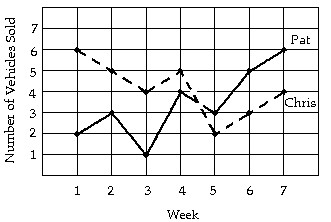 How many vehicles did Pat sell in the third week?
A. 1 vehicle
B. 4 vehicles
C. 3 vehicles
D. 2 vehicles
Answer: A
You might also like to view...
Factor the trinomial completely.15x3 - 2x2 - 8x
A. (x2 - 4)(15x + 2) B. x(15x + 1)(x - 8) C. x(3x + 2)(5x - 4) D. (3x - 2)(5x + 4)
Translate the ellipse with the given equation so that it is centered at the given point. Find the new equation and sketch its graph. +
+  = 1; (-3, 2)
A.  +
+  = 1
= 1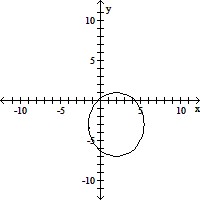
B.  +
+  = 1
= 1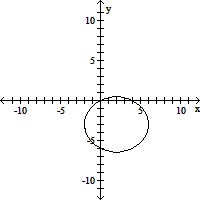
C.  +
+  = 1
= 1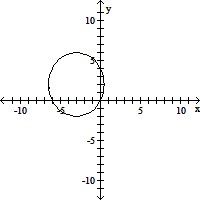
D.  +
+  = 1
= 1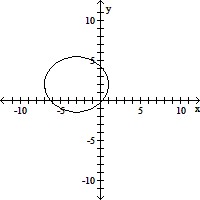
Solve.log4 = x
= x
A. x = 
B. x = 
C. x = 2
D. x = -2
Solve the problem.A piece of equipment was purchased by a company for $10,000 and is assumed to have a salvage value of $3,000 in 10 years. If its value is depreciated linearly from $10,000 to $3,000, find a linear equation in the form V = mt + b, t time in years, that will give the salvage value at any time t, 
A. T = - 700V + 10,000 B. V = - 700t + 10,000 C. V = - 700t - 10,000 D. V = 700t + 10,000