Refer to the following graphs. Which graph(s) represent(s) an externality?
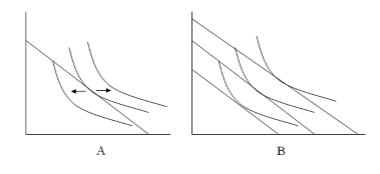
A. graph A
B. graphs A and B
C. graph B
D. neither graph A nor graph B
C. graph B
You might also like to view...
The AA schedule shows
A) Interest rate and output pairs at which the foreign exchange market and the domestic money market are in equilibrium. B) Exchange rate and output pairs at which the foreign exchange market and the domestic money market are in equilibrium. C) Interest rate and output pairs at which only the foreign exchange market is in equilibrium. D) Exchange rate and output pairs at which only the foreign exchange market is in equilibrium. E) Exchange rate and output pairs at which only the domestic money market are in equilibrium.
As a source of funds for nonfinancial businesses, stocks are relatively more important in
A) the United States. B) Germany. C) Japan. D) Canada.
Ceteris paribus, the fear among travelers created by the 9-11 attacks would have what impact on the market for air travel?
a. an increase in equilibrium price and an increase in equilibrium quantity. b. an increase in equilibrium price and a decrease in equilibrium quantity. c. a decrease in equilibrium price and an increase in equilibrium quantity. d. a decrease in equilibrium price and a decrease in equilibrium quantity.
An intended goal of expansionary fiscal policy and an easing of monetary policy is
A. an increase in the price level. B. an increase in the level of aggregate output. C. an increase in interest rates. D. the equalization of the distribution of income.