Simple Harmonic Motion: The figure shows a graph of the position x as a function of time t for a system undergoing simple harmonic motion. Which one of the following graphs represents the acceleration of this system as a function of time?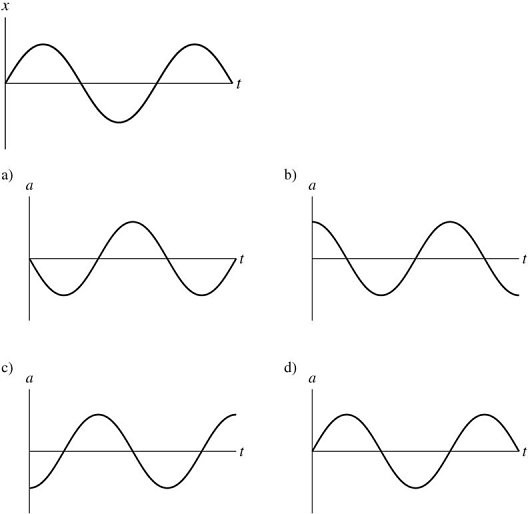
A. graph a
B. graph b
C. graph c
D. graph d
Answer: A
You might also like to view...
Choose the best answer. The Milky Way Galaxy
a. is part of a cluster of a few dozen galaxies. b. is about 200 light-years in diameter. c. is the largest known object in the universe. d. is part of a cluser of a few dozen galaxies, is about 200 ly in diameter, and is the largest known object in the universe e. is part of a cluster of a few dozen galaxies and is the largest known object in the universe
According to the unified model of active galactic nuclei, ___________ is in the center surrounded by _____________with a Type 1 Seyfert or Type 2 Seyfert being seen depending on the viewing angle
a. a supermassive black hole; an accretion disk b. a supermassive black hole; empty space c. no black hole; an accretion disk d. no black hole; empty space
When the equation Sb2S3 + HCl ? SbCl3 + H2S is balanced, the total of all the coefficients (both written and "understood") is
a. 10. b. 14. c. 9. d. 12.
Which of these is true about the relationship between the absorption spectrum and the emission spectrum of a given gas?
a. The emission spectrum has fewer lines than the absorption spectrum. b. The absorption spectrum is multicolored bright lines while the emission spectrum is dark lines. c. All the lines in the emission spectrum correspond to lines in the absorption spectrum. d. All the lines in the absorption spectrum correspond to lines in the emission spectrum. e. Helium was discovered from emission spectra.