Make a bar graph to represent the data.The following table shows the number of male infants born at Hospital X on New Year's Day (Jan. 1). Create a horizontal bar graph.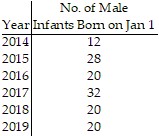
What will be an ideal response?
Answers may vary. A possible answer follows.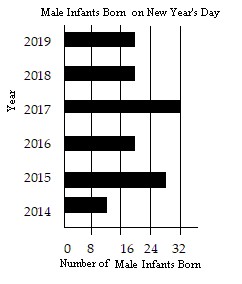
You might also like to view...
Find the flux of the vector field F across the surface S in the indicated direction.F(x, y, z) = 3i + 9j + 7k , S is the rectangular surface z = 0, 0 ? x ? 1, and 0 ? y ? 9, direction k
A. 27 B. 0 C. 81 D. 63
Use the earthquake magnitude scale to answer the question.How many times as much energy is released by an earthquake of magnitude 4 as by one of magnitude 2?
A. 106 times as much energy B. 104 times as much energy C. 102 times as much energy D. 103 times as much energy
Add or subtract as indicated. Write your answer in the form a + bi.[(3 + 8i) - (4 + 7i)] - (5 - 3i)
A. 12 + 4i B. -6 + 4i C. 12 + 12i D. -6 + 12i
Solve the quadratic inequality by sketching the graph of the corresponding quadratic function.x2 + 4x - 32 > 0
A. Solution: (-?, -8) ? (4, ?)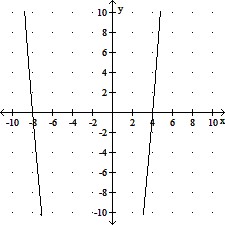
B. Solution: ?
C. Solution: (-8, 4)
D. Solution: (-?, -8] ? [4, ?)