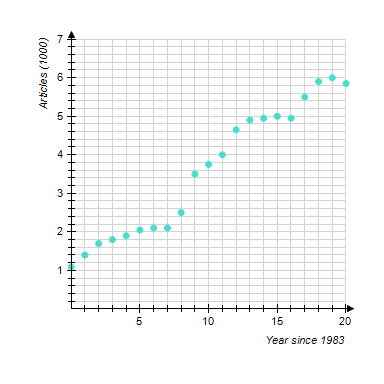
The chart shows the number of research articles in the prominent journal Physics Review that were written by researchers in Europe during 1983 - 2003 ( represents 1983).
?
?
Which of the following logistic functions best models the data? (?t is the number of years since 1983.) Try to determine the correct model without actually computing data points.
?
(A)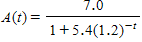
?
(B)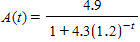
?
(C)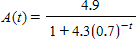
?
(D)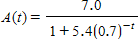
?
__________
?
According to the model you selected, at what percentage was the number of articles growing around 1984?
?
__________%
What will be an ideal response?
A; 16
You might also like to view...
Work the application. Write a legend and an equation. Solve the equation and answer in a complete sentence.The area of a rectangular piece of plywood is 45 square inches and the width is 9 inches. Find the length.
A. Let x = the length of the rectangular piece of plywood. 9 ? x = 45 The length of the rectangular piece of plywood is 4 inches. B. Let x = the length of the rectangular piece of plywood. x ? 9 = 45 The length of the rectangular piece of plywood is 5 inches. C. Let x = the length of the rectangular piece of plywood. 45 - 9 = x The length of the rectangular piece of plywood is 36 inches. D. Let x = the length of the rectangular piece of plywood. 9 + 9 + x + x = 45 The length of the rectangular piece of plywood is 8 inches.
Solve the equation.5(y + 6) = 6(y - 6)
A. -6 B. 66 C. 6 D. -66
Graph.7x2 - 4y2 = 56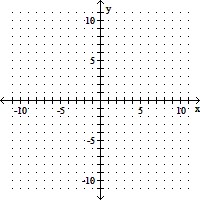
A. 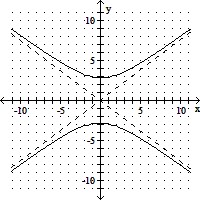
B. 
C. 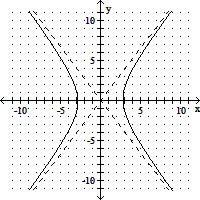
D. 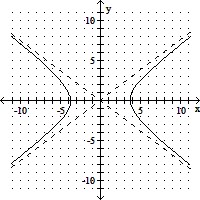
Determine the average rate of change for the function.h(x) = -  x - 3
x - 3
A. 3
B. - 
C. 
D. -3