Tell whether a linear model or a quadratic model is appropriate for the data. If linear, tell whether the slope should be positive or negative. If quadratic, decide whether the leading coefficient a of x2 should be positive or negative.The height of a bouncing ball during one bounce, as a function of time.
A. quadratic; negative
B. quadratic; positive
C. linear; positive
D. linear; negative
Answer: A
You might also like to view...
Answer the questionWhat type of variation is suggested by the graph?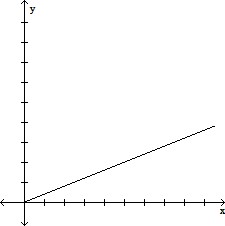
A. y varies directly as the square of x B. y varies inversely as x C. y varies inversely as the square of x D. y varies directly as x
For the function as defined that is one-to-one, graph f and f-1 on the same axes.f(x) = 2x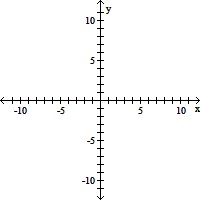
A. 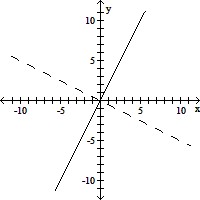
B. 
C. 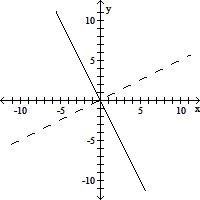
D. 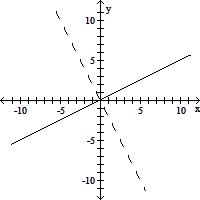
Use the circle graph to solve the problem.The circle graph shows the percent of the total population of 75,100 of Springfield living in the given types of housing. Find the number of people who live in duplexes. Round your result to the nearest whole number.
A. 1 people B. 751 people C. -3004 people D. 74,349 people
Solve by completing the square.3x2 - 8x - 6 = x2 + 3x - x(x + 1) + 1
A. 
B. 
C. 
D. 