Suppose the price of gasoline rises and consumers cut back on their use of gasoline relative to other consumer goods. This situation would contribute to which bias in the consumer price index?
a. Substitution bias.
b. Transportation bias.
c. Quality bias.
d. Indexing bias.
a
You might also like to view...
A curve that shows the various combinations of goods and services that are possible for an economy to produce with a given amount of resources is referred to as a(n):
A) supply curve. B) isocost curve. C) budget constraint. D) production possibilities curve.
Suppose that, in the long run, a dairy's variable costs are VC = 2Q2 (where Q is the number of gallons of milk produced each day), its marginal cost is MC = 4Q and there is an avoidable fixed cost of $50 per day. In the long run there is free entry into the market. What is the efficient scale of production?
A. 5 gallons per day B. 100 gallons per day C. 20 gallons per day D. 50 gallons per day
Refer to the information provided in Table 3.2 below to answer the question(s) that follow.Table 3.2Price per CheeseburgerQuantity Demanded (Cheeseburgers per Month)Quantity Supplied (Cheeseburgers per Month)$51,500 500 61,200 700 7 900 900 8 6001,100 9 3001,300Refer to Table 3.2. If the price per cheeseburger is $8, there is an excess
A. supply of 500 cheeseburgers. B. supply of 1,100 cheeseburgers. C. demand of 300 cheeseburgers. D. demand of 600 cheeseburgers.
Refer to the graph below showing the revenue curves for a monopolist. At what output level is demand inelastic?
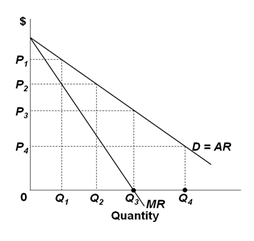
A. Q1
B. Q2
C. Q3
D. Q4