How is the Solow residual measured? What problems arise in its measurement when resource utilization varies over the business cycle? What implications do these measurement issues have for evidence supporting the RBC model?
What will be an ideal response?
The Solow residual is measured as Y / (Ka N1-a). But when resource utilization varies over the business cycle, this isn't the correct measure of productivity. As a result, productivity appears to be procyclical, but in fact productivity might be constant. Thus the fact that the measured Solow residual is strongly procyclical, which has been taken as evidence in support of RBC models, may not be proof that productivity shocks drive the business cycle.
You might also like to view...
The principal objective of WTO is to:
a. reduce the level of all tariffs. b. establish fair prices for all goods traded internationally. c. prevent the trading of services across nations' borders. d. encourage countries to establish quotas.
Which of the following propositions would a proponent of supply-side economics be most likely to stress?
a. Higher marginal tax rates will lead to a reduction in the budget deficit and lower interest rates, because they expand government revenues. b. Higher marginal tax rates promote economic inefficiency and thereby retard aggregate output, because they encourage investors to undertake low-productivity projects with substantial tax-shelter benefits. c. Income redistribution payments will exert little impact on real aggregate supply, since they do not consume resources directly. d. A tax reduction will increase the disposable income of households. Thus the primary impact of a tax reduction on aggregate supply will stem from the influence of the tax change on the size of the budget deficit or surplus.
Refer to the accompanying figure. When the price is equal to 8, the price elasticity of demand for the demand curve D1 is ________ and for D2 the price elasticity of demand is ________.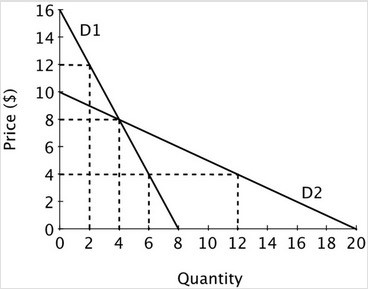
A. 4; 4 B. 4; 1 C. 1; 4 D. 2; 4
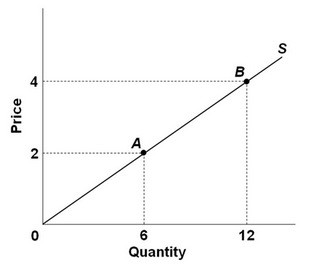 Refer to the figure above. What is the price elasticity of supply between points A and B above?
A. 2 B. 1 C. -1 D. 1/3