The line graph shows the percentage of obese adults in a certain city by age. Based on the information in the graph, represent the set using the roster method.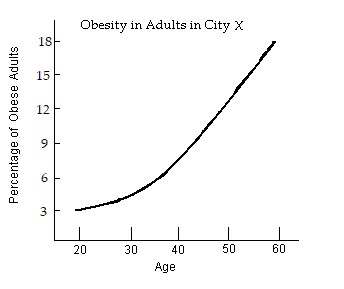 {x | x is an age at which 12% of adults in city X are obese}
A. {40}
B. {30}
C. {50}
D. {60}
Answer: C
You might also like to view...
Solve the problem.An assistant accountant takes 3 hr longer to file the same number of tax returns as a senior accountant. If they work together, they can file the tax returns in 1 hr. To the nearest tenth of an hour, how long does it take each accountant to file the tax returns working alone?
A. Senior accountant: 1.3 hr Assistant accountant: 2.3 hr B. Senior accountant: 2 hr Assistant accountant: 5 hr C. Senior accountant: 4.3 hr Assistant accountant: 4.3 hr D. Senior accountant: 1.3 hr Assistant accountant: 4.3 hr
Solve the problem.There were 620 people at a play. The admission price was $2 for adults and $1 for children. The admission receipts were $960. How many adults and how many children attended?
A. 340 adults and 280 children B. 280 adults and 340 children C. 240 adults and 380 children D. 140 adults and 480 children
Find the equation in slope-intercept form of the line satisfying the conditions.m =  ; y-intercept (0, -3)
A. y =  x + 3
x + 3
B. y = -  x - 3
x - 3
C. y =  x - 3
x - 3
D. y = -  x + 3
x + 3
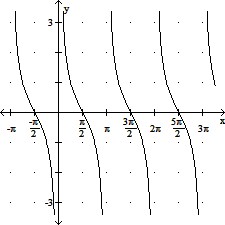
Graph the function.y = cot x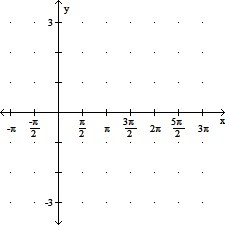
A. 
B. 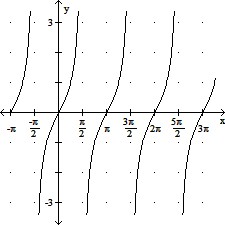
C. 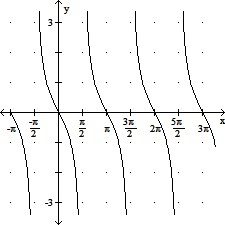
D.