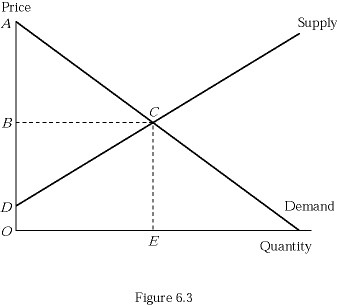
 Refer to Figure 6.3. On this graph, the total surplus of the market is maximized when the price is at point:
A. A.
B. B.
C. zero.
D. D.
Answer: B
You might also like to view...
When a monopolist integrates vertically with another monopolist the result:
a. is always beneficial to consumers. b. is never beneficial to consumers. c. may or may not be beneficial to consumers. d. does not have any effect on consumers.
The markup pricing technique involves determining the selling price of a good by adding a profit markup to minimum average cost. This would result in maximum profits only if
a. average cost were constant. b. the markup were zero. c. the markup varied with the elasticity of demand. d. demand were inelastic.
The relationships between elasticity and total revenue hold because:
a. total revenue equals price divided by quantity demanded b. total revenue equals price times quantity demanded c. a drop in price has two opposing effects on the two components of the formula d. both b and c
In analyzing the gasoline tax and subsidy policy discussed in the text, the final solution illustrates that
A. the government is made better off financially. B. consumers do not cut back on fuel consumption. C. consumers are worse off than they were before the policy began. D. social welfare increases.