Perform the indicated operation.
 - 2
- 2
A. 16 - 10
B. -1
C. -6
D. 12 - 10
Answer: C
You might also like to view...
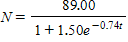
A fish population grows according to the logistic model
 .
.
Here t is measured in years and N is measured in thousands of tons.A: Make a graph of the fish population over the first 20 years.B: According to the model, what is the carrying capacity for this fish population in this environment?C: According to the model, what is the optimum yield level for harvesting the fish?D: How long does it take for the fish population to grow from the optimum yield level to 90% of carrying capacity?
?
Round your answers to two decimal places, if necessary.
What will be an ideal response?
Provide an appropriate response.Graph y = - tan x and its derivative together on  . Does the graph of
  appear to have a largest slope? If so, what is it? If not, explain.
What will be an ideal response?
Solve the problem.Explain why  = 5.
= 5.
What will be an ideal response?
Factor by grouping.15x2 - 9x - 20x + 12
A. (3x - 4)(5x - 3) B. (15x - 4)(x - 3) C. (3x + 4)(5x + 3) D. (15x + 4)(x + 3)