Refer to the figure below. In response to gradually falling inflation, this economy will eventually move from its short-run equilibrium to its long-run equilibrium. Graphically, this would be seen as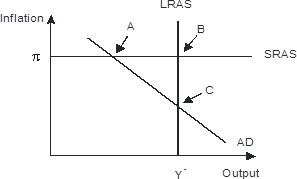
A. long-run aggregate supply shifting leftward
B. Short-run aggregate supply shifting downward
C. Aggregate demand shifting rightward
D. Aggregate demand shifting leftward
Answer: B
You might also like to view...
Use the following graphs to answer the next question.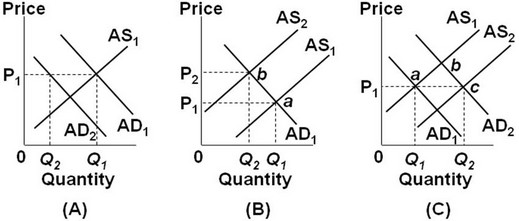 In the diagrams, AD1 and AS1 are the "before" curves. Assuming Q1 is full-employment output, a recession is depicted by ________.
A. panel (A) only B. panel (B) only C. panel (C) only D. panels (A) and (B)
The employment ratio is the ________
A) labor force divided by the population B) proportion of the civilian working-age population that is employed C) number of individuals employed divided by the size of the labor force D) number of individuals employed divided by the number of the unemployed
Consider the distributed lag model Yt = ?0 + ?1Xt + ?2Xt-1 + ?3Xt-2 + … + ?r+1Xt-r + ut. The dynamic causal effect is
A) ?0 + ?1 B) ?1 + ?2+…+?r+1 C) ?0 + ?1+…+?r+1 D) ?1
Graphically, market supply for a product:
A. is the horizontal difference of the individual supply curves. B. is the horizontal sum of the individual supply curves. C. is the vertical difference of the individual supply curves. D. is the vertical sum of the individual supply curves.