Solve the problem.The following data represents the normal monthly precipitation for a certain city. 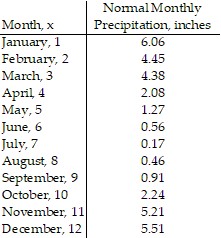 Draw a scatter diagram of the data for one period. Find a sinusoidal function of the form
 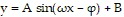 that fits the data. Draw the sinusoidal function on the scatter diagram. Use a graphing utility to find the sinusoidal function of best fit. Draw the sinusoidal function of best fit on the scatter diagram.
What will be an ideal response?
y = 3.14 sin(0.46x + 1.53) + 3.16;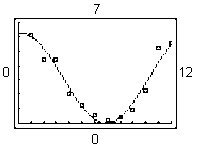
Mathematics
You might also like to view...
Determine the domain of f.f(x) = 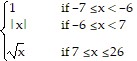
A. [-7, ?) B. [-7, 7) ? (7, 26] C. [7, 26] D. [-7, 26]
Mathematics
Determine whether function f represents exponential growth, exponential decay, linear growth or linear decay. Find a formula for f.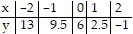
A. Linear growth; f(x) = 3.5x + 6 B. Exponential decay; f(x) = 6(-2.5)x C. Linear decay; f(x) = -3.5x + 6 D. Exponential growth; f(x) = 6(3.5)x
Mathematics
Use the binomial theorem to expand the expression.(5x - 4y)3
A. 125x3 - 300x2y + 240xy2 - 64y3 B. 25x3y - 40x2y2 + 16xy3 C. 25x3y - 20x2y2 + 16xy3 D. 125x3 - 100x2y + 80xy2 - 64y3
Mathematics
Solve the given equation. Give an exact solution.log3x = 4
A. 
B. 
C. 
D. 
Mathematics