The following graph shows the populations of the metropolitan areas of City X and City Y over six years. 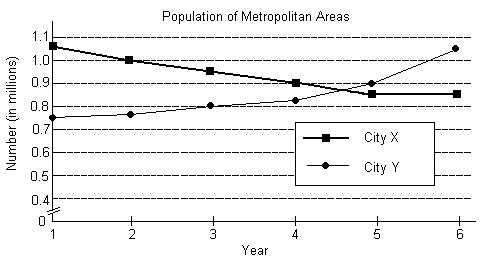 In what years was the population of the City X metropolitan area less than that of the City Y metropolitan area?
A. Years 1-5
B. Years 3-5
C. Years 5-6
D. Years 1-3
Answer: C
Mathematics
You might also like to view...
Write the fraction or mixed number as a percent. Write the percent using decimals.
A. 0.09% B. 9% C. 90% D. 0.9%
Mathematics
Provide an appropriate response.Consumers will purchase q units of a certain product when the price is 340 - 2q dollars per unit. How many units must be sold in order that sales revenue be no less than $14,000?
What will be an ideal response?
Mathematics
Determine if the graph of the function is concave up or concave down.y = (x + 2)2
A. Concave down B. Concave up
Mathematics
Find the standard equation of the hyperbola.Foci at (0, ±7), a conjugate axis with length 10
A.  -
-  = 1
= 1
B.  -
-  = 1
= 1
C.  -
-  = 1
= 1
D.  -
-  = 1
= 1
Mathematics