A group of 100 adults were asked what type of cake was their favorite. The circle graph shows the results.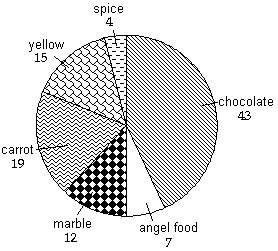 ?What percent preferred marble cake?
A.  %
%
B.  %
%
C. 12%
D.  %
%
Answer: C
You might also like to view...
Use an Euler diagram to determine whether the argument is valid or invalid. is less than 14.7 is less than 14. Therefore,
  is less than 7.
A. valid B. invalid
Which of the following physical situations would best be modeled by the graph?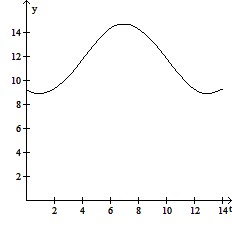
A. The length y of a shadow cast by a tree between sunrise and noon, where t is the angle of elevation of the sun.
B. The monthly average ocean temperature y in degrees Fahrenheit during month t, where t = 1 corresponds to January.
C. The length y of a shadow cast by a horizontal flagpole on a vertical wall between sunrise and noon, where t is the angle shown.
D. The number of hours y of sunlight during month t, where t = 1 corresponds to January.
Provide an appropriate response.Points represent:
A. an additional cost of financing B. monthly payments C. 2 percent of the amount borrowed D. a 3 percent up front payment
Solve the system of equations graphically. x = y - 23x = 2y
A. (6, 4) B. (-4, 2) C. (0, 0) D. (4, 6)