The table shows, for some particular year, a listing of several income levels and, for each level, the proportion of the population in the level and the probability that a person in that level bought a new car during the year. Given that one of the people who bought a new car during that year is randomly selected, find the probability that that person was in the indicated income category. Round your answer to the nearest hundredth. 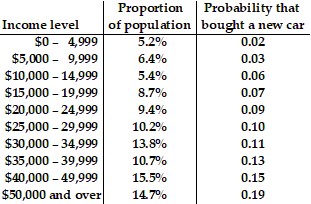 $40,000 - $49,999
A. 0.22
B. 0.25
C. 0.21
D. 0.17
Answer: C
You might also like to view...
Identify the missing terms of the polynomial.-4x2 + 5x3 + 3x4 + 3
A. 0x2 B. 9 C. 0x0 D. 0x
Solve.A meteor circles the earth in an elliptical orbit. The major axis of the elliptical orbit is 24 × 108 miles long and the minor axis is 10 × 108 miles long. If the earth is at one focus of the orbit what is the distance from the other focus?
A. 2 ×  × 108 mi
B.  × 104 mi
C. 2 ×  × 104 mi
D. 2 ×  × 103 mi
The table lists data that are exactly linear. (i) Find the slope-intercept form of the line that passes through these data points. (ii) Predict y when x = -1.5 and 4.6. 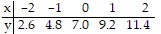
A. y = 2.2x + 7; y = 3.70, y = 17.12 B. y = 2.2x - 7; y = -10.3, y = 3.12 C. y = -2.2x - 7; y = -3.7, y = -17.12 D. y = -2.2x + 7; y = 10.3, y = -3.12
For the given function expressed verbally, give a graphical representation. To convert x square feet to y square yards, divide x by 9. Let y = f(x) and 0?x?100.
A. 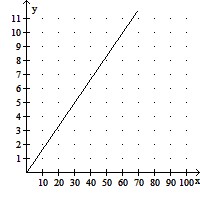
B. 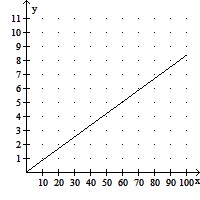
C. 
D. 