The table above gives the production possibilities frontier for two countries, Anaconda and Bear. The opportunity cost of moving from production point B to production point C for Anaconda equals ________ and for Bear equals ________
A) 50 pairs of shoes; 100 pairs of shoes
B) 100 pairs of shoes; 200 pairs of shoes
C) 1 ton of corn; 1 ton of corn
D) 550 pairs of shoes; 700 pairs of shoes
E) 650 pairs of shoes; 900 pairs of shoes
B
You might also like to view...
The phenomenon that unusual events are likely to be followed by more nearly normal is known as:
A. regression to the mean. B. anchoring and adjustment. C. fungibility. D. the adaptive rationality standard.
Assume that the graph below describes the current labor market for nurses in a mid-sized city and that the labor market is perfectly competitive.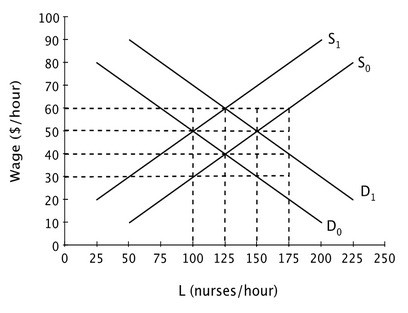 If supply shifts from S0 to S1 and demand shifts from D0 to D1, then the equilibrium wage will ________, and the equilibrium number of nurses will ________.
A. increase; increase B. stay the same; increase C. increase; stay the same D. stay the same; stay the same
The aggregate supply curve
A. embodies the same logic that lies behind an individual firm's supply curve. B. is the sum of the individual supply curves in the economy. C. relates output with the price level. D. is a market supply curve.
If a firm's total costs are $75 when it produces 10 units of output and $80 when it produces 11 units of output, then the marginal cost of producing the 11th unit is
A. $1. B. $5. C. $8.09. D. $10.