A scatter diagram plots the value of one economic variable against time
Indicate whether the statement is true or false
FALSE
You might also like to view...
What are the major rationales for consumer protection in nonmonopolistic industries?
What will be an ideal response?
An increase in demand for a product and a reduction in the costs of production would: a. increase the equilibrium quantity and increase the equilibrium price
b. increase the equilibrium quantity and decrease the equilibrium price. c. increase the equilibrium quantity and cause an indeterminate change in the equilibrium price. d. decrease the equilibrium quantity and cause an indeterminate change in the equilibrium price.
In Graph C, if P1 moved to P2 which of the following would most likely happen?
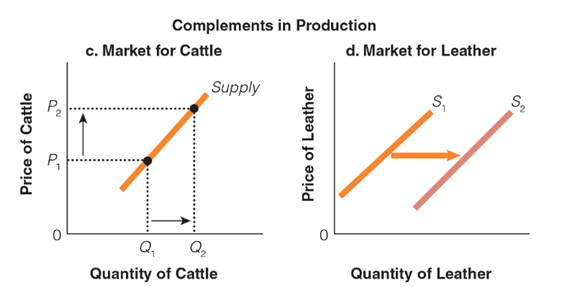
a. The price of leather would decrease.
b. The price of leather would decrease, but the quantity of leather would increase.
c. The price of leather would increase, but the quantity of leather would decrease.
d. The quantity of leather would increase.
Refer to the information provided in Table 20.4 below to answer the question(s) that follow. Table 20.4GermanyChileBeerWineBeerWine(cases)(cases)(cases)(cases)75030 060152412453018 24304512 361560 6 48075 0 60 Refer to Table 20.4. Chile has
A. an absolute advantage and a comparative advantage in beer production. B. an absolute advantage and a comparative advantage in wine production. C. a comparative advantage in wine production. D. neither a comparative advantage in wine production nor in beer production.