Based on the pie chart showing federal government revenue, the two sources that combine to provide roughly 80% of federal revenue are ______.
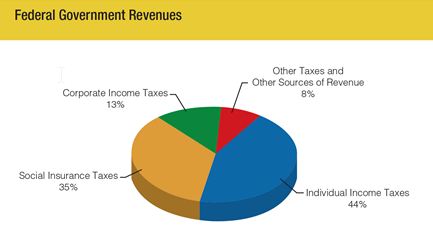
a. individual income tax and corporate income tax
b. corporate income tax and social insurance tax
c. social insurance tax and individual income tax
d. miscellaneous other tax and social insurance tax
c. social insurance tax and individual income tax
You might also like to view...
Comparing a market basket A to other market baskets, we can say that for a typical consumer, A is preferred to baskets to the
a. southwest but less preferred to baskets to the northeast. b. northeast but less preferred to baskets to the southwest. c. northwest but less preferred to baskets to the southeast. d. southeast but less preferred to baskets to the northwest .
A time series graph can show both the level of a variable and the speed with which the variable changes over time
Indicate whether the statement is true or false
According to the table above, ________ percent of total income is redistributed to the lowest income group
A) 4.7 B) 2.3 C) 1.5 D) 3.8
If the domestic consumers of a good benefit from free trade, it suggests that the country:
A. is a net exporter of that good. B. is not able to produce that good. C. is a net importer of that good. D. has a comparative advantage in that good.