Graph the function f(x) over the given interval. Partition the interval into 4 subintervals of equal length. Then add to your sketch the rectangles associated with the Riemann sum  , using the indicated point in the kth subinterval for ck.f(x) = x2 - 3, [0, 8], right-hand endpoint
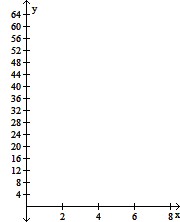
A. 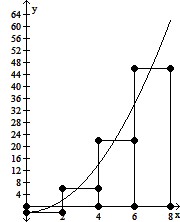
B. 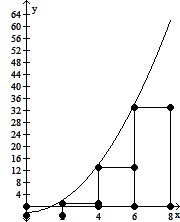
C. 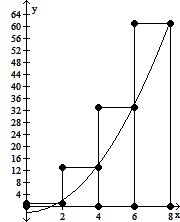
D. 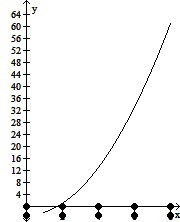
Answer: C
You might also like to view...
Provide an appropriate response.Suppose the ratio of the number of hours a coffee shop is opened to the number of daily customers it gets is constant. When it is opened 3 hours, the number of customers is 180 less than the maximum number of customers. When it is opened 11 hours, the number of customers is 20 less than the maximum number of customers. Write an equation describing this situation and find the maximum number of daily customers.
What will be an ideal response?
Find the quantity if v = 5i - 7j and w = 3i + 2j. -
- 
A. 
B.  -
- 
C. 2 -
- 
D. 
Determine whether or not the relationship shown in the table is a function.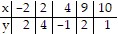 Does the table define y as a function of x?
A. Yes B. No
Find the partial fraction decomposition for the rational expression.
A.  +
+  -
- 
B.  -
-  -
- 
C.  +
+  -
- 
D.  +
+  +
+ 