Solve the problem.The accompanying graph shows the average number of degrees above/below normal in December from 2000-2009 where x = 0 represents 2000. 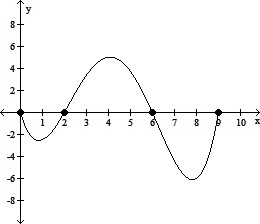 Estimate the number of degrees above zero in 2004. Round to the nearest tenth.
A. 5 degrees above normal
B. 141 degrees above normal
C. 32 degrees above normal
D. 1.3 degrees above normal
Answer: A
Mathematics
You might also like to view...
Use a graphing calculator to find the value of the determinant.
A. 22 B. -22 C. 142 D. -2
Mathematics
Simplify the expression.cos  tan
tan  sec ?
sec ?
A. 1 B. sin ? - csc ? C. -1 D. -cos ? + sec ?
Mathematics
Solve the equation. - 3 = -2
A. 22 B. -20 C. -22 D. 20
Mathematics
Perform the division.(x4 - 256) ÷ (x + 4)
A. x3 + 4x2 + 16x + 64 B. x3 - 4x2 + 16x - 64 C. x2 + 4x + 16 D. x3 + 4x2 - 16x + 64
Mathematics