This graph demonstrates the domestic demand and supply for a good, as well as the world price for that good.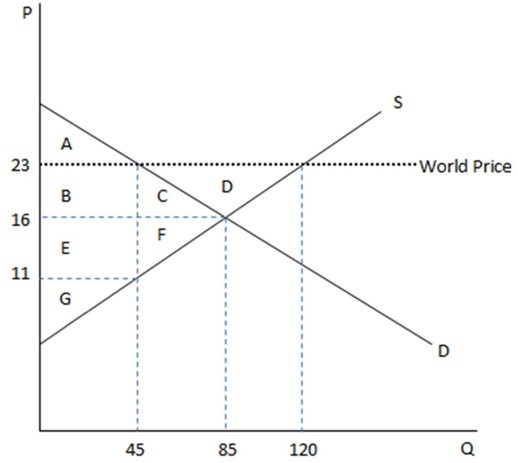 According to the graph shown, if this economy were to open to trade, the amount consumed domestically would:
A. decrease by 40.
B. increase by 40.
C. increase by 35.
D. increase by 75.
Answer: A
You might also like to view...
Which of the following statements about the Sherman Act is CORRECT?
A) The Sherman Act was the second federal antitrust law. B) The Sherman act legalized monopolization if the company behaved "reasonably" once it became a monopoly. C) The Sherman Act outlawed natural monopolies. D) The Sherman Act made restriction of interstate trade illegal.
Which of the following activities describes the opportunity cost of attending an economics class?
What will be an ideal response?
The massive deficit in the U.S. current account primarily reflects the
A. excess of foreign investment in the U.S. over domestic private investment. B. excess of U.S. exports over U.S. imports. C. transfers of money home by U.S. citizens working in other countries. D. excess of U.S. imports over U.S. exports.
As a result of the war in Afghanistan, the population of Afghanistan as well as their capital stock was reduced. This can be illustrated by the aggregate supply curve
A. shifting outward. B. becoming flatter. C. shifting inward. D. becoming more elastic.