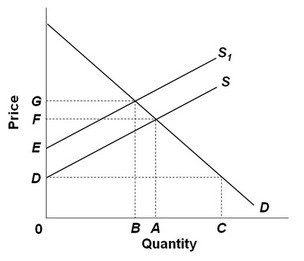
 Refer to the above supply and demand graph. In the graph, point A is the current equilibrium level of output of this product and point B is the optimal level of output from society's perspective. S is the supply curve without a tax and St is the supply curve with a tax. The external cost to society from the production of each unit of this product is measured by:
A. AB.
B. EF.
C. FG.
D. DE.
Answer: D
You might also like to view...
Describe the potential negative effects of an additional tax on the sale of all-terrain vehicles (ATVs) within the United States
What will be an ideal response?
The rule of 70 is: a. the ratio of 70 to the growth rate of a nation
b. the sum of 70 and the growth rate of a nation. c. the difference between 70 and the growth rate of a nation. d. the product of 70 and the growth rate of a nation.
Refer to the accompanying figure. For Pat, the opportunity cost of planting one bulb is removing: 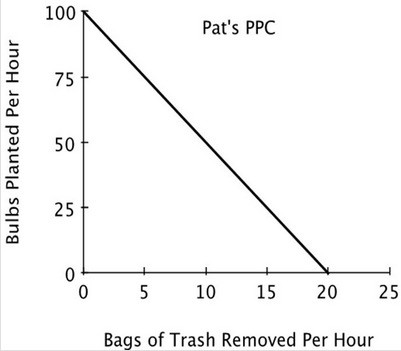
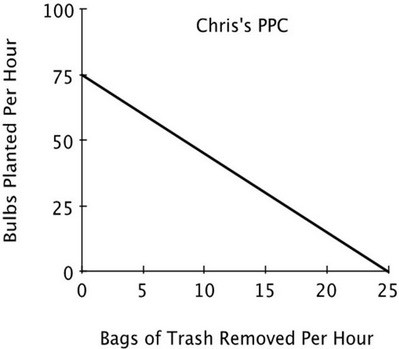
A. 5 bags of trash. B. 20 bags of trash. C. 1/5 of a bag of trash. D. 1/20 of a bag of trash.
Joe's Taco Hut can purchase a delivery truck for $20,000 and Joe estimates it will generate a net income (after taxes, maintenance and operating costs) of $4,000 per year. His other option is to go to work for someone else earning net income of $3,000 per year. He should:
A. not purchase the truck if the real interest rate is greater than 1 percent. B. purchase the truck if the real interest rate is less than 5 percent. C. purchase the truck if the real interest rate is greater than 5 percent. D. purchase the truck if the real interest rate is less than 15 percent.