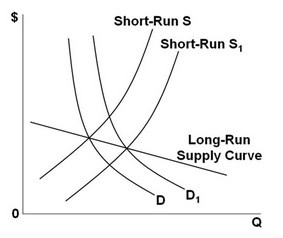
 The graph above represents a(n):
A. decreasing-cost industry: firms may be paying lower prices for their inputs when the industry expands.
B. increasing-cost industry: firms may be paying higher prices for their inputs when the industry expands.
C. constant-cost industry: prices of the inputs stay the same, and other production costs are constant as the industry expands.
D. competitive, break-even industry: the long-run supply curve is upward sloping as it must be according to the law of supply.
Answer: A
You might also like to view...
Wealth is defined as the:
A. value of monetary assets. B. value of assets that can be converted to cash on short notice. C. value of all assets minus the money that is owed. D. total amount of income earned in a one-year period.
Suppose you buy two tickets to the concert; one for you and one for your girlfriend. Nevertheless, the day of the concert your car brakes down preventing both of you from attending it. Assuming both you and your girlfriend had the same preferences, which of the two of you stand to lose the most from not being able to attend the concert?
A. Both of you stand to lose the same. B. Your girlfriend. C. You. D. None of you would stand to lose anything.
U.S. and Japanese automakers __________ during the automobile VER of the 1980s.
a. both suffered losses b. were locked in a contentious trade war c. both enjoyed higher prices and higher profits d. both felt that the other side had more gains
Sources of microeconomic failure that may require government intervention include all of the following except:
A.) The abuse of market power. B.) The need for private goods. C.) The need for public goods. D.) Inequities in the distribution of goods and services.