Solve the problem.Suppose that the speed of a car, measured in miles per hour (mph), is monitored for some short period of time after the driver applies the brakes. The following table and graph relate the speed of the car to the amount of time, measured in seconds (sec), elapsed from the moment that the brakes are applied.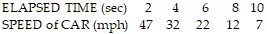
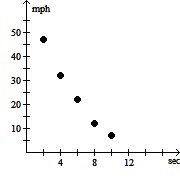 What general trend do the data reflect? In which of the time intervals does the speed change the most?
A. With increasing elapsed time, the speed increases. The speed changes most during the time interval from 8 seconds to 10 seconds.
B. With increasing elapsed time, the speed increases. The speed changes most during the time interval from 2 seconds to 4 seconds.
C. With increasing elapsed time, the speed decreases. The speed changes most during the time interval from 2 seconds to 4 seconds.
D. With increasing elapsed time, the speed decreases. The speed changes most during the time interval from 8 seconds to 10 seconds.
Answer: C
You might also like to view...
A set of n = 15 pairs of scores (X and Y values) has SSX = 4, SSY = 25, and SP = 6. What is the Pearson correlation for these data?
a. 6/(10/sqrt(15)) b. 6/10 c. 6/(100/15) d. 6/100
Identify all values for which the expression is undefined.
A. None B. 0 C. -6 D. 6, -6
Solve the application and answer with a complete sentence.13 of those that Stephen called, agreed to donate money. This amounted to 5% of those that he called. How many people did he call?
A. Stephen called 260 people. B. Stephen called 2600 people. C. Stephen called 250 people. D. Stephen called 310 people.
Simplify.(4x2 + 5x + 20) + (-6x2 - 8x - 9)
A. -2x2 + 3x + 11 B. -2x2 - 3x + 11 C. -2x2 - 3x + 29 D. -2x2 + 11x + 29